How many calories are in trail mix?
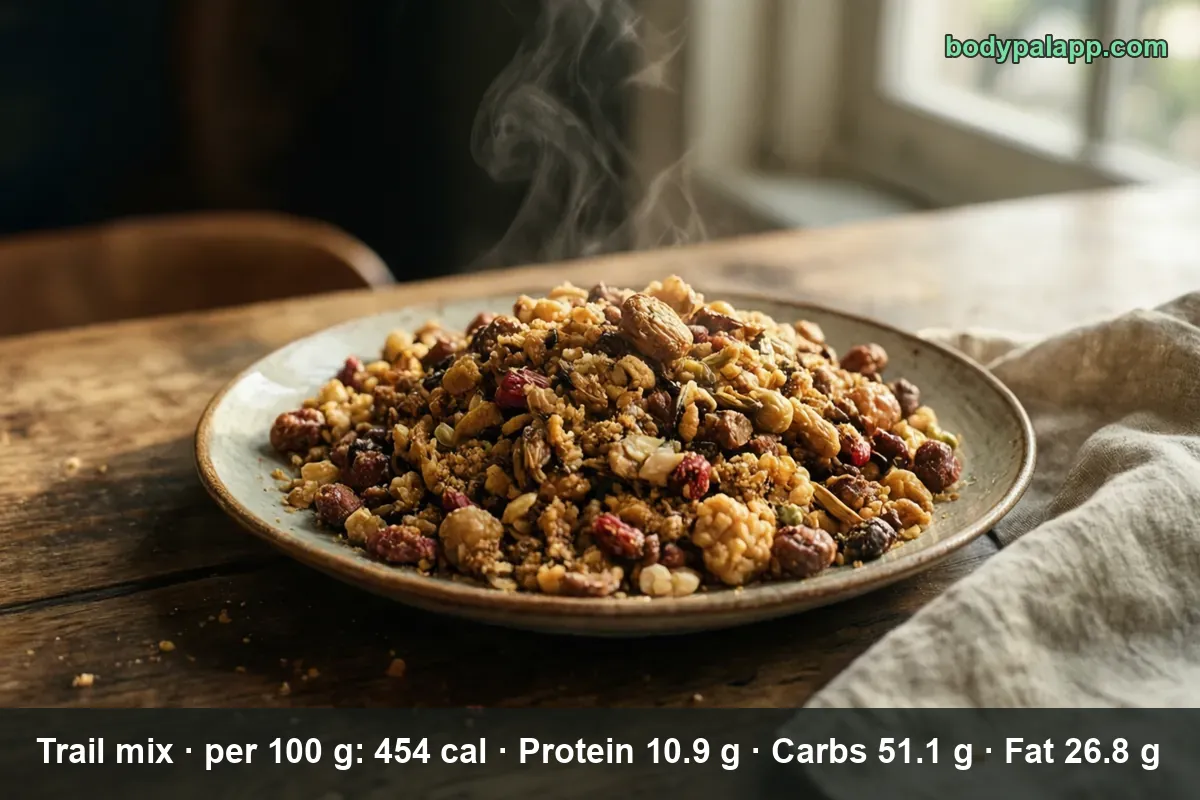
A 1-cup serving of trail mix weighs 140 g and carries 636 calories. Per 100 g the mix runs 454 calories, which puts it in the same weight class as almonds and chocolate. The number nobody expects is how far a cup sits from the ounce most labels print: 636 against 127 calories.
You'd need to walk about 2 hours to burn the 636 calories in a 1-cup (140 g) serving.
How long does it take to burn off trail mix?
A 1-cup (140 g) serving is 636 kcal. Enter your weight and the amount you ate to see how long it takes you to burn that off:
lb
| Activity | Time to burn 636 kcal |
|---|---|
| Walking, brisk | 2 hr 7 min |
| Cycling, moderate | 1 hr 20 min |
| Swimming, moderate | 1 hr 31 min |
| Jogging | 1 hr 15 min |
| Weight training, moderate | 2 hr 21 min |
Times are for a 155 lb adult at a steady pace; change the weight to see yours. The amount is set to the portion in the text (140 g); change it to what you actually ate. BodyPal works this out from your steps automatically.
On this page
- Trail mix quick facts
- US servings from a handful to a full cup
- Which mix you grabbed changes the number
- Tropical and unsalted versions
- Fat sugar and the rows that surprise people
- How does trail mix compare?
- Most popular trail mix brands
- FAQ
Trail mix quick facts
The row used here is FNDDS 2707574, "Trail mix, NFS" — the generic blend of nuts, dried fruit and granola clusters, which is what people are actually holding when they look this up. It is also the only trail mix record that carries a complete profile: sugars, fiber, potassium and household measures all in one place. The older SR Legacy entries list fat and protein but leave sugars and fiber blank, so they cannot fill a full label.
The cup column below is the USDA household measure for that record, not a scaled guess.
| Nutrient | Per 100 g | Per 1 cup (140 g) | % Daily Value |
|---|---|---|---|
| Calories | 454 | 636 | — |
| Total fat | 26.83 g | 37.6 g | 48% |
| Saturated fat | 3.69 g | 5.2 g | 26% |
| Carbohydrate | 51.06 g | 71.5 g | 26% |
| Dietary fiber | 6.4 g | 9.0 g | 32% |
| Total sugars | 36.48 g | 51.1 g | — |
| Protein | 10.9 g | 15.3 g | 31% |
| Sodium | 134 mg | 188 mg | 8% |
% Daily Value is based on a 2,000-calorie diet.
Verified nutrition data
Numbers on this page come from USDA FoodData Central, the U.S. Department of Agriculture’s food composition database, and from manufacturer labels where a branded product is named. Last verified September 2026. How we verify our data →
Two rows you would see on a store package are missing here: added sugars and trans fat. USDA does not publish either value for this record, so rather than guess at how much of the sugar comes from chocolate chips versus raisins, they are left out. Cholesterol is 0 mg, which is expected in a plant-only snack. Potassium is 522 mg per 100 g, or 731 mg in a cup — 16% of the Daily Value, and one of the quieter reasons hikers like the stuff.
US servings from a handful to a full cup
| Serving | Weight | Calories |
|---|---|---|
| 1 oz, one level handful | 28 g | 127 kcal |
| 1/4 cup | 35 g | 159 kcal |
| 1/2 cup | 70 g | 318 kcal |
| Single-serve package | 50 g | 227 kcal |
| 1 cup | 140 g | 636 kcal |
| Per 100 g | 100 g | 454 kcal |
Only the 1-cup line, the ounce and the 50 g package come straight from USDA measures. The quarter cup and the half cup are our own arithmetic from the USDA 100 g figure, not USDA servings — though 1/4 cup is the measure most US brands print on the back of the bag, which is why it is worth knowing in calories.
That is the trap on this page. An ounce is 127 calories, a cup is 636, and the cup is exactly five times the ounce by weight. Trail mix is light in the hand and heavy on the scale, so a portion that looks modest in a cereal bowl is closer to a meal than a snack. Pour it into a measuring cup once and the mental picture sticks.
Brand labels tell the same story with slightly bigger numbers. Signature Farms Nut Trail Mix is 567 calories per 100 g, and its labeled 1/4 cup (30 g) is 170 calories; the fruit-and-nut version from the same line is 450 per 100 g, with a heavier 40 g quarter cup at 180 calories. Nut-forward blends pack more calories into less volume, so the same scoop weighs differently depending on the recipe.
Which mix you grabbed changes the number
| Version | Per 100 g | 1 cup (140 g) | Sugars per 100 g | Sodium per 100 g |
|---|---|---|---|---|
| Trail mix, NFS | 454 kcal | 636 kcal | 36.48 g | 134 mg |
| With nuts, no dried fruit | 604 kcal | 846 kcal | 4.1 g | 252 mg |
| With chocolate | 503 kcal | 704 kcal | 34.85 g | 146 mg |
| With pretzels, cereal or granola | 476 kcal | 666 kcal | 19.32 g | 414 mg |
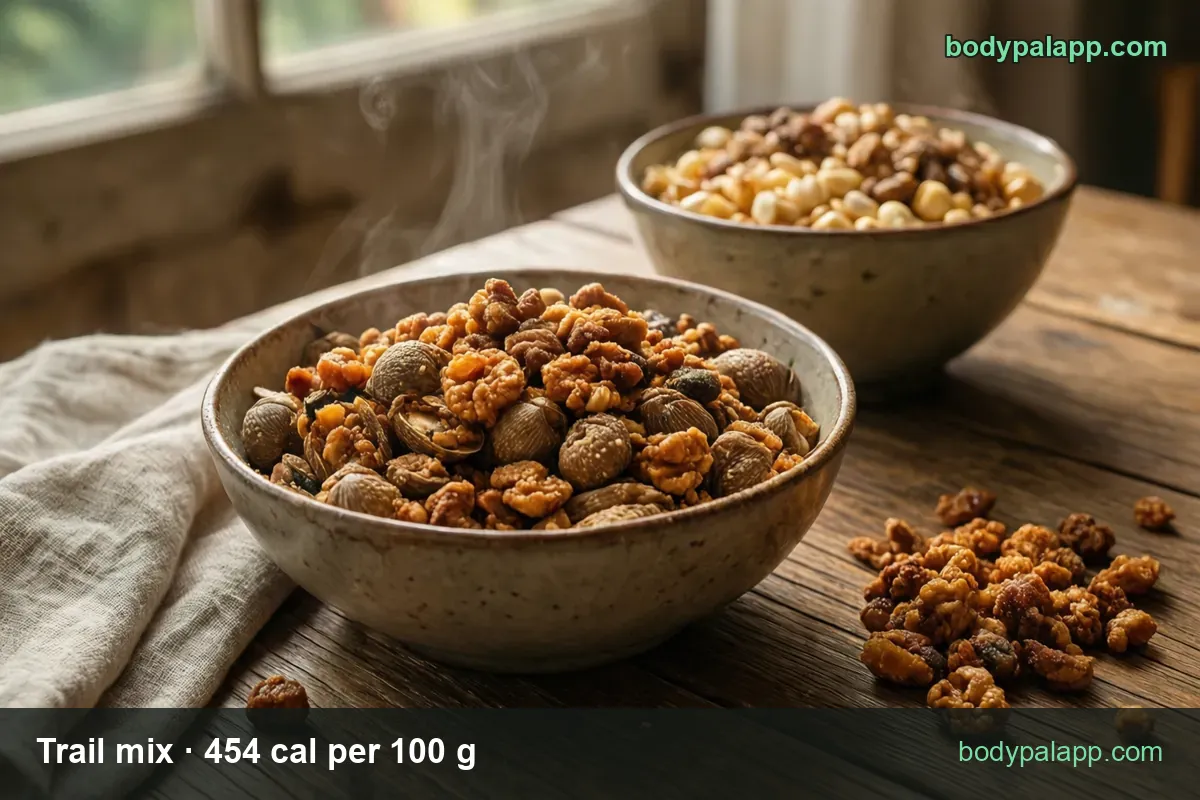
Here is the finding that runs against intuition: taking the dried fruit out makes the mix heavier, not lighter. A nut-only blend is 604 calories per 100 g against 454, so a cup jumps from 636 to 846. What the fruit does is swap fat for sugar — total sugars fall from 36.48 g per 100 g to 4.1 g when the raisins and cranberries leave.
Chocolate costs less than people fear on calories and more than they expect on saturated fat. The chocolate mix adds 68 calories per cup over the generic one, but saturated fat almost doubles, from 3.69 g to 7 g per 100 g. That is 9.8 g in a cup, or 49% of the Daily Value in one sitting.
The pretzel, cereal and granola version is the sodium outlier: 414 mg per 100 g against 134 mg for the generic mix. A cup of it carries about 580 mg of sodium — 25% of the Daily Value, versus 8% for the standard blend, and roughly a quarter teaspoon of table salt. If you are watching sodium rather than calories, that is the version to skip.
Tropical and unsalted versions
The older SR Legacy records cover the packaged mixes sold by weight, and they scale to the ounce that labels use.
| Version | Per 100 g | 1 oz (28 g) | Protein per 100 g |
|---|---|---|---|
| Regular, salted | 462 kcal | 129 kcal | 13.8 g |
| Regular, unsalted | 462 kcal | 129 kcal | 13.8 g |
| With chocolate chips and salted nuts | 484 kcal | 136 kcal | 14.2 g |
| Tropical | 442 kcal | 124 kcal | 6.3 g |
Salted and unsalted are identical on calories, protein and fat — the only line that moves is sodium, 229 mg per 100 g against 10 mg. Scaled to an ounce that is about 64 mg versus 3 mg, our own arithmetic from the USDA 100 g figures. Nobody should pick unsalted to lose weight; pick it if blood pressure is the number you are tracking.
Tropical mix is the lightest of the four, at 442 calories per 100 g and 124 per ounce. It gets there by replacing nuts with dried papaya, pineapple and banana chips, and protein collapses from 13.8 g per 100 g to 6.3 g. Five calories saved per ounce is not a win worth having if the trade is more than half the protein.
Note that three of these four SR Legacy rows leave sugars and fiber blank, so a sugar comparison across this table is not possible — USDA publishes those values only for the chocolate-chip record.
Fat sugar and the rows that surprise people
Total fat is the only line in the cup column that clears 40% of the Daily Value: 37.6 g, or 48%. Everything else lands lower — fiber 32%, protein 31%, carbohydrate and saturated fat 26% each. The fat is mostly the unsaturated kind from nuts and seeds, which is why saturated fat stays at a fairly civil 26% while total fat runs high. The FDA Daily Value reference sets those benchmarks at 78 g of total fat and 20 g of saturated fat.
Fiber is the honest bright spot. A cup delivers 9.0 g, close to a third of the 28 g Daily Value, and even a single ounce brings 1.8 g. Most Americans fall short of the fiber target described in the Dietary Guidelines, and a nut-and-fruit snack is a painless way to move that number.
Sugar deserves a fair reading. The 36.48 g per 100 g looks alarming next to the 50 g added-sugars limit, but these are total sugars, most of them fruit sugars in the raisins and cranberries. Total sugars have no Daily Value for exactly this reason, and comparing them to the added-sugars cap is the wrong comparison. If the mix has yogurt-coated pieces or candy in it, that math changes — but USDA does not break out added sugars on this record, so the label on your bag is the better source there.
The practical takeaway matches how MyPlate frames nuts and seeds: a small measured portion is a genuinely good snack, and an unmeasured one is dessert with a health halo.
How does trail mix compare?
| Food | Per 100 g | US serving | Calories |
|---|---|---|---|
| Trail mix | 454 kcal | 1 oz, 28 g | 127 kcal |
| Coconut, packaged | 456 kcal | 1 oz, 28 g | 128 kcal |
| Almond paste | 458 kcal | 1 oz, 28 g | 128 kcal |
| Chia seeds | 486 kcal | 1 oz, 28 g | 136 kcal |
Our take: these four are effectively the same food by the calorie, and trail mix is the lightest of them by a margin of two calories per 100 g — which is noise, not a difference. Choose on what the ounce gives you back, not on calories. Trail mix wins on protein for the price, at 10.9 g per 100 g against 3.13 g for packaged coconut. Chia costs 9 more calories an ounce and returns 16.54 g of protein per 100 g, the best of the four. Almond paste is the one to treat as a baking ingredient rather than a snack, since nothing about it stops at an ounce.
Most popular trail mix brands in the United States
Ranked by how widely each product appears among foods sold in the United States, from the BodyPal food database of over 3.3 million products. Calories are the figures printed on each Nutrition Facts label, checked against USDA FoodData Central.
| Product | Calories (per 100 g) |
|---|---|
| Signature Farms Nut Trail Mix | 567 cal |
| Signature Select Winter Wonderland Trail Mix | 531 cal |
| Signature Select Ginger Zinger Trail Mix | 516 cal |
| Signature Select Trail Mix | 514 cal |
| Signature Select Autumn Harvest Trail Mix | 484 cal |
| Signature Farms Nut and Fruit Trail Mix | 450 cal |
Brand popularity: BodyPal food database. Nutrition: manufacturer labels / USDA FoodData Central.
Trail mix FAQs
How many calories are in a cup of trail mix?
A 1-cup serving weighs 140 g and carries 636 calories, based on the USDA generic trail mix at 454 calories per 100 g. That cup also brings 37.6 g of fat and 51.1 g of total sugars, which is why a cup eaten straight from the bowl disappears faster than most people expect.
How many calories are in 1 oz of trail mix?
One ounce is 28 g and 127 calories. That is the portion most nutrition labels use, and it matches the USDA measure of 454 calories per 100 g. An ounce also gives you 3.1 g of protein, 1.8 g of fiber and 38 mg of sodium.
How many calories are in a handful of trail mix?
A level handful is close to 1 oz, so 127 calories. A generous scoop is nearer a quarter cup, 35 g and 159 calories. Both are our own arithmetic from the USDA 100 g figure. Two absent-minded handfuls put you past 250 calories before the bag looks touched.
Is trail mix good for weight loss?
It can be, at 127 calories per ounce, but only if you measure it. The trouble is density: 454 calories per 100 g means a cup is 636. Portion an ounce into a small container and it works well as a snack; eat from the bag and it rarely does.
How much protein is in trail mix?
Generic trail mix has 10.9 g of protein per 100 g, so a 1-cup serving delivers 15.3 g, or 31% of the Daily Value. A nut-heavy mix does much better at 20.06 g per 100 g. An ounce, the realistic snack size, gives you about 3.1 g.
How much sugar is in trail mix?
Total sugars run 36.48 g per 100 g, so a cup carries 51.1 g. Most of that is fruit sugar from raisins and dried cranberries rather than syrup, though USDA does not publish an added sugars figure for this record. A nut-only mix drops to 4.1 g per 100 g.
Does chocolate trail mix have more calories?
Yes — chocolate trail mix is 503 calories per 100 g against 454 for the generic version, so a cup goes from 636 to 704 calories. Saturated fat is the bigger jump: 7 g per 100 g versus 3.69 g, which works out to 9.8 g in a cup, or 49% of the Daily Value.
Is tropical trail mix lower in calories?
Slightly — tropical trail mix is 442 calories per 100 g, so an ounce is 124 calories against 127 for the standard mix. The trade is protein: 6.3 g per 100 g versus 10.9 g, because dried papaya and banana chips replace much of the nuts. It satisfies less.
Similar foods
- Churro — 189 cal each
- Fudge — 70 cal per piece
- Popcorn — 73 cal per cup popped
- Kettle corn — 74 cal per cup
- Sesame sticks — 151 cal per oz
- Funnel cake — 318 cal per cake, 6-inch
Count it without the math
Point the camera at the bowl and BodyPal counts the mix for you, clusters and dried fruit included.